Analysis and Reporting in the Oracle EPM World (Part 1)
A picture is worth a thousand words, don't you think? I love a report with a pixel-perfect chart. But why not go beyond a table and pie chart?
Are you using the reporting tool that portrays your key information most effectively? Continuing the premise of the importance of analysis and reporting for finance, I want on this occasion share with you a short discussion about the different options that Oracle EPM has to offer you and the differences among them.
At the time of writing, Oracle offers six (6) tools to help you to create interactive reports and analysis. In Part 1, I will cover Adhoc in the Web & Excel, Dashboards and Reports / Financial Reporting. In Part 2, I will discuss Narrative Reporting and Oracle Analytics Cloud.
What are they?
Adhoc in the Web & Excel
Adhoc analysis web and Excel (using Oracle Smart View) is a functionality that helps you to design your reports and retrieve and analyse data by selecting members, using functions, and performing a variety of operations, in addition to setting custom formatting. |
| View of Adhoc analysis from Excel (Smart View) |
- Read/write/calculate capability
- No need to leave the web interface and no need to have SmartView installed
- Ability to export to Excel
- Drill through to the source
- Available for all the EPM instances
- It's not user friendly (but getting better with new releases)
- Not an ideal tool for creating reports
- You need a license to Read, Write and Calculate data
Advantages (Smartview based ad-hoc)
- Read/write/calculate capability
- Slice and dice data in a familiar interface
- Users can create their own custom reports
- Drill through to the source
- Available to download for all EPM users
Disadvantages (SmartView based ad-hoc)
- Not many, SmartView is amazing 😊
- Lack of ability to produce sophisticated report layouts
- You need a license to Read, Write and Calculate data
Analysing Data Using Dashboards
Dashboards helps you to overview key information and gives the chance to modify your data at the same time you review it. This option is very useful when you start your planning and forecast process.
 |
| Dashboards 1.0 with Multiple Charts |
With Dashboards, you can work with forms and charts. For example, when reviewing your forecast, you can change a driver in your grid and see the impact immediately in a chart or a secondary form.
Dashboards are currently available in two versions:Dashboards 1.0 — Uses Oracle ADF technology and you can:
- Edit data directly on forms.
- Add links to dynamically display external Web pages.
- Include explanations of data called Commentary in the dashboard.
- Tag a form as master and then filter members from the master form to detail forms or charts within the same dashboard.
- Add hierarchical labels in charts.
- Use a logarithmic scale in relevant chart types.
- Add a secondary Y-axis in relevant chart types.
- Add new chart types like Waterfall, Pyramid, and Geomap and new sub-chart types for Radar, Combination, and Gauge charts. It also supports creating tables in dashboards with visual inline views of data, called Spark Charts.
Advantages:
- Read, Write and Calculate capabilities.
- "Drill- through" to the source options.
- Available for all the EPM instances.
- With dynamic retrievals the forms and charts are interactive
- The Dashboards tool is only available from your EPM workspace and you need a license to interact with them.
Reports and Legacy Financial Reporting
Oracle has spent the last couple of months advertising this new - not that new - tool. Reports will replace the legacy Financial Reporting (FR). But what are these tools?
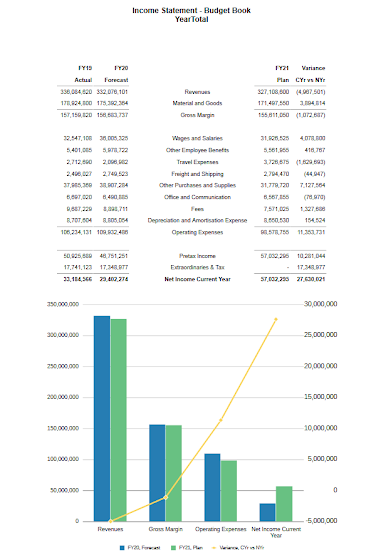
Reports and FR are tools to help you visualize, distribute and print reports from a single Data Source. You can run these reports in HTML, PDF and Export to Excel (Only in FR).

You can also create Books that provide the ability to group together one or more reports and other documents, to generate a single PDF output. You can optionally include a customized Table of Contents.
To distribute them, you can use Bursting definitions to run a single report or book and publish a PDF. Using this feature, you can send an email with the published PDF files attached to a specified recipient list who do not need to be a licensed user. You can also save the published PDF files to the Library.I have written an entry about Reports. If you want to know more check it out here.
Advantages:
- Easy to distribute and print reports.
- No need for User access to visualize the reports.
- The Reports tool includes a new generation of Intelligent Narrative with conditional text and Analytics.
- Read Only reports.
You can read many other useful Oracle EPM Cloud and NetSuite ERP blogs posted by my colleagues at Brovanture here.
Cristina.


Comments
Post a Comment